In our previous post, we discussed exploring new ways to market your products. We listed 3 of our favorite internet tools:
- The US Census Bureau website.
- Easy Analytic Software Inc (EASI) Demographics tool.
- Small Business Development Center's Geographic Information Systems (GIS) reports.
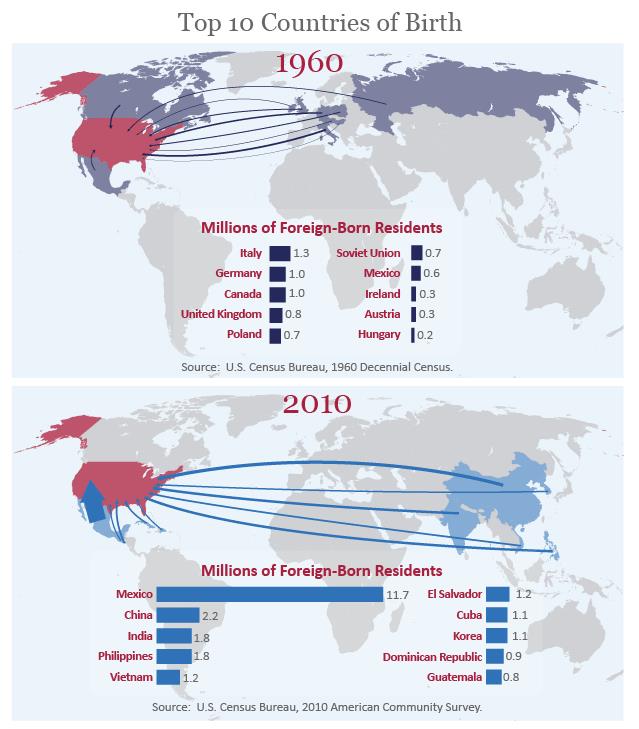
In this post, we will focus on The US Census Bureau website. Census data is presented in multiple ways including:
- infographics (an example is presented in Image 1, below).
- interactive maps.
- audio.
- photos.
- publications.
- video.
- working papers.
- software.
For this series, we will continue to use wine as our example.
Imagine that you read an article about which alcoholic beverages pair well with authentic Chinese food and you learned that Rieslings are a good choice since “they go well with Chinese cuisine because the mouth-feel is quite refreshing…the range of dry to sweet Rieslings can match all types of Chinese food, plus it’s never too heavy, but rather fresh and fruity.” Now you begin to think about:
- how you could inform current customers that your wines pair well with this popular cuisine (this article provides wine pairing recommendations for “Americanized Chinese” takeout – which also suggests Riesling as being an appropriate choice) and
- how you could promote your Riesling to the Chinese consumers who may live in your region.
One of the first things you want to do for #2 is to learn whether there is a population of Chinese consumers in your county or metro area (and city if the population is large enough) and how many are ages 21 and older. For this example, we used the State College, PA metropolitan area as the location for learning about the existence and number of adults who responded during the 2010 Census that they were “Chinese (except Taiwanese) alone or in any combination.”
The tool we are demonstrating also allows us to search for data for “Chinese alone or in any combination” (which would include Taiwanese) and “Taiwanese alone or in any combination.” Hence, you can get fairly specific with your data requests. (The “alone or in any combination” means that the data describes those who indicated on their Census form that they were only Chinese as well as Chinese consumers who indicated that they were also of another race/ethnicity).
The abbreviated table below provides the following information: Total Chinese population (3,360 individuals in the State College, PA metropolitan area), as well as a breakdown by age range (e.g. 68.1% of these individuals were 21 and older in 2010), and the number of males who were between the ages of 20 and 24 (524 or 15.6% of the total population of Chinese).
Image 2. A portion of a table that describes the total population of Chinese (except Taiwanese) and breakdown by age range and other characteristics based on the 2010 U.S. Census.

There are many ways to build tables like the one presented for this demonstration. We simply used “metro/micro statistical area within state” and “Race and Hispanic Origin” as our search criteria and then selected the “DP-1 Profile of General Population and Housing Characteristics: 2010” (Image 3).
Image 3. Search fields and options available to create tables like that in Image 2 (From the US Census Bureau website).

One caveat is that data is only available if more than 100 individuals are in the group you are investigating. For example, with the State College metropolitan area being less populated than other metro areas in the state, there were not enough “Argentinians,” “Nicaraguans,” or others from select South American countries to create tables (though we were able to learn that at the time of the 2010 Census, there were 651 “South Americans” residing in the metro area). In contrast, data for the much larger metropolitan Philadelphia area showed that there were 2,336 Argentinians residing in this location. If there is a large population of Argentinians in your area and you want to promote a wine that will pair well with traditional “pork dishes and rich, winter-warming meat stews” then you would focus on your Cabernet Sauvignon (http://bit.ly/LjvC0R).
As you can see, the US Census Bureau website can provide a tremendous amount of demographic data for your specific target market location. Our next tool for learning about new markets is the Easy Analytic Software Inc (EASI) Demographics tool which will be discussed in the next post.