Authors

Showing posts with label penn state. Show all posts

Friday, April 1, 2016

Developing a Tasting Room Loyalty Program Part 2

By Dr Kathy Kelley--Professor of Horticultural Marketing and Business Management and Dana Ollendyke-- Extension Associate

In our previous post, we discussed what a loyalty program should do for your business--which, simply put, it should help increase your tasting room’s profits! In this post, we will discuss developing an outline for your loyalty program.

A loyalty program rewards program (photo credit: iQoncept/Dollar Photo Club).

The great thing about offering a loyalty program is that customers understand their basic function, as they most likely belong to other programs. Regardless of the type of program you offer, consider these key questions:
  • Your overall goal – what do you hope to achieve?
  • Will charge customers to join the program, limit the number of members, or will enrollment be free?
  • How will customer purchases will be recorded?
  • What questions will you ask members that will help enhance the program and their experience?
  • What purchases will “count” towards loyalty program benefits, what can members redeem points on, and would a program co-developed with a complementary business be perceived as being even more attractive?
  • How you will determine that loyalty has really been established?
  • How and when might need to end the program (and steps for doing so)?
The next post in this series will focus on your overall loyalty program goal.


Friday, March 25, 2016

Developing a Tasting Room Loyalty Program Part 1

By Dr Kathy Kelley--Professor of Horticultural Marketing and Business Management and Dana Ollendyke-- Extension Associate

If you are a winery owner, you most likely have some type of “case club” or “customer loyalty” program in place, or you have thought about implementing one at your tasting room. Whatever you call it, the intent is probably the same – you try to reward customers who purchase large quantities of wine from you in the form of a discount and/or invitation to special events.


A customer purchase of multiple bottles of wine (photo credit Efired/ Dollar Photo Club).


If crafted and administered correctly, these programs benefit the customer and the tasting room, but sometimes they do not provide the desired return on investment. This blog series will help you take a look at your current (or potential) loyalty program and decide whether your program needs to be tweaked or radically changed in order to be more successful.

What should a loyalty program do for your business? Simply put, your loyalty program should help increase your tasting room’s profits. A research paper written by Sports Loyalty International, a customer loyalty program developer, outlines some of the general benefits of creating a loyalty program.

By enrolling in a loyalty program, members: 

  • may be less likely to “defect” and purchase from another winery
  • could increase their spending over time 
  • and could be more responsive to promotions.

These factors could reduce your marketing costs since you will have information about their preferences and habits, allowing for a more targeted promotional effort. 

Additionally, customers may shift spending to “higher margin products”, and members could refer your program to friends and family based on their positive experience.

The next post in this series will focus on your business's goals for the loyalty program.

Thursday, November 5, 2015

"Mandatory" social media platforms for agricultural businesses

By Dr Kathy Kelley, Professor of Horticultural Marketing and Business Management, and Dana Ollendyke, Extension Associate


Through an internet survey conducted by researchers at Penn State, Rutgers, Cornell, and New York University in 2013, 1,183 participants answered questions concerning their wine purchasing and consumption attitudes and behaviors and their demographic and socioeconomic status. Panelists were screened for being at least 21 years old, residing in one of the targeted mid-Atlantic states (New York, New Jersey, or Pennsylvania), and for having purchased and drank wine at least once within the previous year.

This survey may be focused on wineries, but the data collected can be of use to many agricultural business types. Marketing is an integral part of doing business.  Using social media to inform consumers about your products and events is an excellent way to build relationships.

John Gillespie, founder and CEO of Wine Opinions, a wine research company, stated in the article "Who’s Drinking Wine? A Look at the Wine Market Council’s Latest Survey" that 66% of core wine drinkers (those who drink wine at least once a week) and 40% of marginal wine drinkers (those who drink wine less frequently than once a week) use the internet to get information about wine. The article also said that more than half of all wine drinkers are on Facebook.

Consumers who participated in our internet survey were asked to select from a provided list of social media platforms they felt were mandatory for a winery to offer.  As you can see by Figure 1, Facebook is the significant front-runner.  Over 40% of participants believed that this social media tool is "mandatory" for a winery to implement.  Other platforms like Twitter, Pinterest, Instagram, and YouTube were significantly less important to respondents.

Figure 1. Social media platforms that survey respondents believed were "mandatory" for a winery to implement.


More information about the survey results can be viewed in the video series "Consumer Attitudes and Behaviors Towards Wine Purchases".

To learn more about social media marketing and the survey data, please see video 5 in the series.

As an agricultural business owner, what social media platforms do you use?  Which one(s) seems to drive the most interaction with your customers?

Thursday, October 1, 2015

What Is Your Business's Customer Service Philosophy?


 by Juliette Enfield, Penn State Extension Educator, Warren County

Although we give and receive customer service almost every day, we rarely take time to stop and think about what customer service means. Customer service does not come easily or naturally for most people. Providing good customer service is a skill that involves product knowledge, concern or empathy for the customer, readiness to help the customer, and knowing where to go to find answers. John Berry, Extension Educator in Lehigh County reinforces these ideas with a four step process for providing excellent customer service:
Be sure your employees know about the product they are selling.

      Know the Product

      Reach Out


      Be Alert

     Get Help
Customer service affects a business’s bottom line when there are many competitors. The fewer competitors, the less customer service matters, such as in the telephone and internet service provider industry. The more competitors, the more customer service matters, which is the case in the food industry. 
Another benefit to providing good customer service is the cost savings associated with customer retention. Losing one customer can have a domino effect on a business. The business from this customer is lost, but so is the business they could have brought to you, as well as the opportunity to change something that was not working well in your business. Remember these two rules of thumb: attracting new customers costs 5 times more than keeping existing customers, and 80% of your sales come from 20% of your customers.

Taylor's Farm Market (which I recently visited on our Are You Crazy Retail Farm Market Bus Tour) in Inwood, West Virginia shares their customer service philosophy.
You may have protocols in place for handling returns, or complaints, but it’s the customer service philosophy that is portrayed in these actions. Consider what script(s) you want your employees to follow when providing good customer service. For example, Sue Miller of Birchrun Hills Farm in Chester County, PA told me that for her, marketing is about having good relationships and providing good customer service.  She says she enjoys trying to guess what the customer wants. She believes that people don’t want to take advantage of you. She believes in treating people the way she would want to be treated. Sue says that if a customer is ever dissatisfied with her products, she is happy to exchange the product for a new one.
Below are some questions that can help start the customer service conversation at your business. I filled in some of my own reflections to get you started.
1. What is your business’s customer service philosophy?
We want people to feel that we care about them and their health by shopping with us.

2. What makes implementing this philosophy challenging?

Lack of sleep, not being able to relate to the customer-who may not have much awareness about agriculture, who may be from another culture, may make more money than I do, etc....
3. What works?

Not taking criticisms personally, offering services such as carrying heavy items, being honest...
4. What doesn’t work?

Apologizing when I don’t mean it...

5. What kind of customer service do you enjoy when shopping?

I like when the sales person is knowledgeable about the product, I also like when the sales person is not overly aggressive about making sales...

6. Does your business have a customer service training plan in place? Circle one.

Yes                                           No

Useful Books & Videos:
Carlaw, P. and Deming, V. The Big Book of Customer Service Training Games. McGraw-Hill. New York, NY. 1999. (This book is cheap to buy and has fun and educational training games that you could play with your employees)

Wicks, Judy. Good Morning, Beautiful Business. Chelsea Green Publishing. White River Junction, VT. 2013. (This book was featured at the Pennsylvania Women in Ag Network's Annual Symposium in 2013. Judy Wicks spoke about her inspiring business and customer service philosophy.)

Telephone Doctor® CUSTOMER SERVICE TRAINING, 30 Hollenberg Ct. St. Louis, MO 63044,(314) 291-1012, Fax: (314) 291-3710, E-mail: nancy@telephonedoctor.com, www.telephonedoctor.com (Purchasing these tools is not cheap but there are some sample materials on YouTube which are entertaining and educational)


The Learning Service, Ltd., 2800 Market Avenue North Canton, Ohio 44714, Phone: (330) 456-2422, Fax:(330) 456-8944, E-mail: learningservice@aol.com, www.thelearningservice.com (This company has published several books on customer service which are listed on their website)


Sources for this blog:

Berry, John. I Seem to Have Lost a Customer Some Place! April 8, 2014. Agricultural Entrepreneurship Blog. <http://farmbusiness.blogspot.com/2014/04/i-seem-to-have-lost-customer-someplace.html> Accessed Sept 9, 2015.

Lawrence, Alex. Five Customer Retention Tips for Entrepreneurs. Nov 1, 2012.
<
http://www.forbes.com/sites/alexlawrence/2012/11/01/five-customer-retention-tips-for-entrepreneurs/> Accessed Sept 8, 2015.

Makovsky, Ken. Where Customer Service Doesn’t Matter. Jan 23, 2014. <http://www.forbes.com/sites/kenmakovsky/2014/01/23/where-customer-service-doesnt-matter/>Accessed Sept 8, 2015.

Friday, August 14, 2015

What is Cause Marketing? Part 3

By Dr Kathy Kelley, Professor of Horticultural Marketing and Business Management, and Dana Ollendyke, Extension Associate


This post will continue to outline some of the important topics to consider in deciding if a cause marketing plan is right for your business. (Post 1 and Post 2 in this series have been published in previous weeks.)

Promote that you are also accepting donations
In addition to selling a product or two where the proceeds go directly to support the cause, let customers know that they can also donate funds to the cause.  You, as the business owner, may assume that consumers would automatically understand that there is more than one way to support a cause; however, it may not occur to consumers that they can make a donation in place of making a purchase.

Involve customers in selecting the cause
Two separate strategies can be used to involve consumers in selecting the cause:
  • ask consumers to nominate a cause and then vote on the one that will receive all the donations.
  • allow consumers to choose from a group of causes that would receive the donations.
This second technique is what ONEHOPE Wine has embraced. The brand donates half of all profits to a list of causes including: Cure Alzheimer’s Disease, Support Our Veterans, Save Our Planet, and several others. Each wine is associated with a specific cause. In Image 1, you can see that half of the profits for the 2009 Santa Barbara Reserve Chardonnay helps fund research to find a cure for Alzheimer's Disease.

Image 1.  Bottle of OneHope wine that benefits research to find a cure for Alzheimer's Disease.


Involve employees
Finally, employees should be asked to do more than just collect donations or indicate what purchases support the cause.  Involve them in the process of selecting the cause and associated administration needed to support events or activities.  The more employees support the effort, the more likely they are to alert customers that your business is involved in collecting donations to help those in difficult situations.

As with any new marketing program, it is very important to DO YOUR RESEARCH to determine if this is the right path for your business. 

Friday, July 10, 2015

Internet Tools to Help You Learn About New Markets, Part 4

By Dr Kathy Kelley, Professor of Horticultural Marketing and Business Management, and Dana Ollendyke, Extension Associate

In our previous post, we discussed using Easy Analytic Software Inc (EASI), which allows users to more easily search Census data.  This post, which will be the final one in this series, will focus on Geographic Information Systems (GIS) reports from the Small Business Development Center (SBDC).

These reports are free of charge to prospective or existing small business owners who are receiving business-counseling services from their local SBDC Advisor.
Some of the reports include:
  • Competition maps—These maps show the location of individual competitors in relation to a small business location.
  • Competitor lists—These lists can include a competitor’s company name, location, number of employees at each location, whether the location is a competitor’s single location or branch, estimated annual sales volume, the competitor’s NAICS (North American Industry Classification System) and SIC (Standard Industrial Classification) codes and a latitude and longitude coordinate.
  • Consumer expenditure comparison reports—These reports help clients evaluate the relative demand for their chosen industry within their local market area, county, state, and the nation.
  • Drive time reports—The time it takes to travel to a local store or restaurant can be a significant factor in defining the target market for a small business. These highly detailed maps show the geographic boundaries of a small business’ target market customized to the amount of time considered acceptable to the small business’ clientele (Image 1).
Image 1. A sample Drive Time Map showing the market area that can reach a small business destination in Lakewood, CA within 10 minutes. (Contact your local SBDC for a customized map.)


Certainly, this blog series doesn’t discuss all that is needed to better understand consumers’ attitudes, behaviors, etc. towards wine based on their race and ethnicity. It does, however, provide some tools that are useful in gathering data and learning about the population of racial and ethnic groups you could serve in your community.
There are other components such as the consumer’s level of “acculturation,” which is the “cultural modification of an individual, group, or people by adapting or borrowing traits from another culture” (http://bit.ly/1xEH2NK). To demonstrate this point, we will use an example from Kathy’s family. Her sister-in-law was born in South Korea and came to the U.S. 15 years ago. As she has become more ingrained in U.S. society, some of her habits and preferences have become more “mainstream” American. Not only can food choices, etc. change over time, but as someone becomes “fully acculturated,” their language preference can change from their native language to English (http://bit.ly/1IxluaM) which could impact how you choose to promote your wine.
Another component is to search the Internet for “wine and Asian culture,” “wine and Chinese culture,” etc. to learn about wine style preferences and how wine is consumed (e.g. wine and Coke or wine cocktails). Also, don’t forget to investigate what culturally significant holidays these consumers celebrate.
Regardless, conducting adequate research is crucial when developing a realistic marketing plan. By finding out as much as possible about viable consumers, you will have a much better chance of understanding their needs and wants and hopefully gaining them as customers.

Friday, June 26, 2015

Internet Tools to Help You Learn About New Markets, Part 3

By Dr Kathy Kelley, Professor of Horticultural Marketing and Business Management, and Dana Ollendyke, Extension Associate


In our previous post, we discussed using the US Census Bureau website to obtain demographic data for your specific target market location.  Unfortunately, the U.S. Census data can be overwhelming to search through (we admit that it took us a while to find, figure out how to develop the tables, and make changes), so you may want to access other tools that make the Census data more “user friendly.” Easy Analytic Software Inc (EASI) is an example of one of the tools that we often use to obtain consumer demographic information. EASI provides both paid and free options that allow users to more easily search Census data (instructions for navigating to the free tools can be found here).

Image 1 shows how we created a “Free Complete Report & Analysis.” There are many report options (like population by ethnic race, age, sex, etc.) and this one will give you more information that you may need, but you’ll see in Image 2 that it provides a nice breakdown of population by country of origin. We often use the EASI Ring Study as it provides data based on radiuses you select (we used 10, 30, and 50 miles) from an address you provide (we used a Harrisburg, PA address for this example).
Image 1. Criteria used (address and three radiuses) to create a Free Complete Report & Analysis. Click the “Locate!” button after you enter the address in box 1. Then click “Create Site Study” to access the data you requested.


Image 2. Data at the top of this report provides descriptive statistics of the population density, population, and households by year (including projected growth) within 10, 30, and 50 miles from the address used. The comprehensive report also provides population data of those who were of Asian Indian, Bangladeshi, Cambodian, etc. ancestry and who resided within the three radiuses (Image 3).


Image 3. Continuation of report in Image 2.  Population data of those who were of Asian Indian, Bangladeshi, Cambodian, etc. ancestry and who resided within the three radiuses.


These are just a few examples of the many reports EASI can generate for you.  Check out the website to see more detailed demographic information.  Our next tool for learning about new markets is the Geographic Informations Systems (GIS) tool offered by the SBDC which will be discussed in the next post.


Monday, June 8, 2015

Internet Tools to Help You Learn About New Markets, Part 2

By Dr Kathy Kelley, Professor of Horticultural Marketing and Business Management, and Dana Ollendyke, Extension Associate


In our previous post, we discussed exploring new ways to market your products. We listed 3 of our favorite internet tools:
  • The US Census Bureau website.
  • Easy Analytic Software Inc (EASI) Demographics tool.
  • Small Business Development Center's Geographic Information Systems (GIS) reports.

In this post, we will focus on The US Census Bureau website. Census data is presented in multiple ways including:
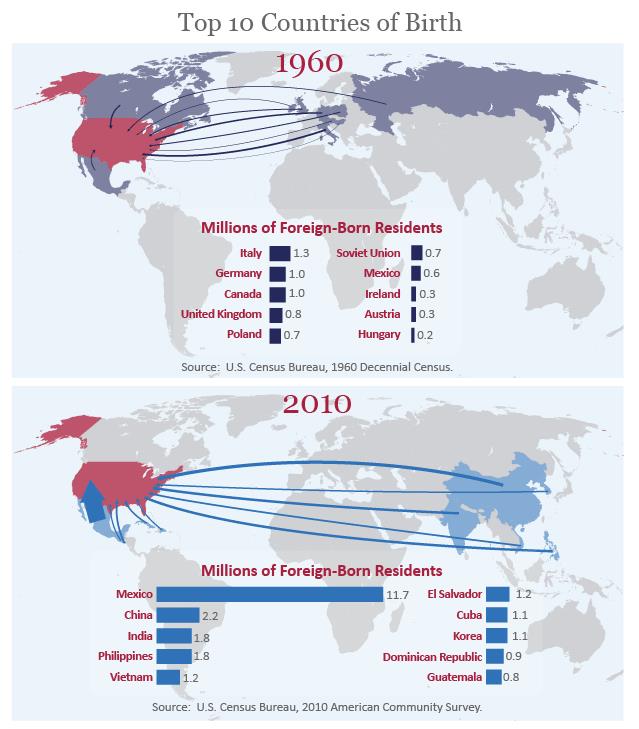
  • infographics (an example is presented in Image 1, below).
  • interactive maps.
  • audio.
  • photos.
  • publications.
  • video.
  • working papers.
  • software.
Image 1. Infographic displaying the changes in the number of foreign-born residents in the U.S. (1960 to 2010) and their native countries (Source: U.S. Census Bureau).


For this series, we will continue to use wine as our example.

Imagine that you read an article about which alcoholic beverages pair well with authentic Chinese food and you learned that Rieslings are a good choice since “they go well with Chinese cuisine because the mouth-feel is quite refreshing…the range of dry to sweet Rieslings can match all types of Chinese food, plus it’s never too heavy, but rather fresh and fruity.” Now you begin to think about:
  1. how you could inform current customers that your wines pair well with this popular cuisine (this article provides wine pairing recommendations for “Americanized Chinese” takeout – which also suggests Riesling as being an appropriate choice) and 
  2. how you could promote your Riesling to the Chinese consumers who may live in your region.
One of the first things you want to do for #2 is to learn whether there is a population of Chinese consumers in your county or metro area (and city if the population is large enough) and how many are ages 21 and older. For this example, we used the State College, PA metropolitan area as the location for learning about the existence and number of adults who responded during the 2010 Census that they were “Chinese (except Taiwanese) alone or in any combination.”

The tool we are demonstrating also allows us to search for data for “Chinese alone or in any combination” (which would include Taiwanese) and “Taiwanese alone or in any combination.” Hence, you can get fairly specific with your data requests. (The “alone or in any combination” means that the data describes those who indicated on their Census form that they were only Chinese as well as Chinese consumers who indicated that they were also of another race/ethnicity).

The abbreviated table below provides the following information: Total Chinese population (3,360 individuals in the State College, PA metropolitan area), as well as a breakdown by age range (e.g. 68.1% of these individuals were 21 and older in 2010), and the number of males who were between the ages of 20 and 24 (524 or 15.6% of the total population of Chinese).

Image 2. A portion of a table that describes the total population of Chinese (except Taiwanese) and breakdown by age range and other characteristics based on the 2010 U.S. Census.


There are many ways to build tables like the one presented for this demonstration. We simply used “metro/micro statistical area within state” and “Race and Hispanic Origin” as our search criteria and then selected the “DP-1 Profile of General Population and Housing Characteristics: 2010” (Image 3).

Image 3. Search fields and options available to create tables like that in Image 2 (From the US Census Bureau website).


One caveat is that data is only available if more than 100 individuals are in the group you are investigating. For example, with the State College metropolitan area being less populated than other metro areas in the state, there were not enough “Argentinians,” “Nicaraguans,” or others from select South American countries to create tables (though we were able to learn that at the time of the 2010 Census, there were 651 “South Americans” residing in the metro area). In contrast, data for the much larger metropolitan Philadelphia area showed that there were 2,336 Argentinians residing in this location. If there is a large population of Argentinians in your area and you want to promote a wine that will pair well with traditional “pork dishes and rich, winter-warming meat stews” then you would focus on your Cabernet Sauvignon (http://bit.ly/LjvC0R).

As you can see, the US Census Bureau website can provide a tremendous amount of demographic data for your specific target market location. Our next tool for learning about new markets is the Easy Analytic Software Inc (EASI) Demographics tool which will be discussed in the next post.

Friday, May 29, 2015

Internet Tools to Help You Learn About New Markets, Part 1

By Dr Kathy Kelley, Professor of Horticultural Marketing and Business Management, and Dana Ollendyke, Extension Associate


In the marketing world, we constantly discuss strategies to increase sales, and these conversations often focus on two options – sell more to your current customers or find new ones.

Most people would agree that it is much easier to meet current customers’ needs and demands because you already have a relationship with them. Therefore, your promotion and advertising “costs” (time and money) should be less than what you might need to acquire new customers.  For this post, we will be using wine as our example.

Imagine that you are looking for new markets to sell your wine to because:
  • your wine production volume has increased. 
  • you feel you have exhausted the local market and have done your best to attract visitors looking for a tasting room experience. 
  • and/or it is essential to investigate new opportunities.
When you first developed your tasting room business plan, you probably gave some thought as to how you would market to consumers and how you would identify potential clientele. If it has been awhile since you’ve reviewed your business plan, you will likely need to update it since your business has probably changed over the years.
 
Customers visiting a winery's tasting room (Photo credit http://bit.ly/1AyDrbl)

Perhaps you not only thought about how you would attract and meet the needs of consumers based on their generation, consumption frequency, and when they drink wine (e.g. while cooking, watching sports, at restaurants, etc), but maybe you even gave some consideration to learning about how different cultures approach wine and include (or exclude) wine from their diets.

We subscribe to several different online newsletters and journals (some of which are international) and regardless of the newsletter/journal’s origin, there is often an article about how a large brand, wine company, or group of wineries are looking to export to emerging markets. Along with providing information about current wine consumption and predictions, wine preferences, and how wine should be presented in the marketing place (cork vs. screw cap, for example), these articles discuss the population of these foreign lands in terms of growth trends, major population centers, generational distribution, major ethnic groups and races, gender breakdown, employment rate, etc. — all of which can help a business determine the viability of the market and to whom/where to market the product.

Though the goal of these articles is to provide information for targeting wine consumers, the information provided can certainly be useful for targeting consumers of any product or service based on specific racial and ethnic heritages.

But how should you begin crafting a strategy to target these consumers?
Winery tasting room owners/operators may be familiar with “who” lives in their city or county, but if you need a refresher or have never really delved into the demographic makeup of these residents, information can be found online in multiple places.

Some of our top picks include:

  • The US Census Bureau website.
  • Easy Analytic Software Inc (EASI) Demographics tool.
  • Small Business Development Center's Geographic Information Systems (GIS) reports.
We will discuss each of these tools in more detail in future posts.

Sunday, April 5, 2015

First Impressions Count – Marketing Display Techniques from the World’s Best Markets

"Pile it high and watch it fly" is a popular marketing tactic that is alive and well in some of the best international markets. This month, members of the Penn State Extension Marketing team traveled to Barcelona to participate with market professionals from 6 continents and learn from some of the most profitable markets in the world. A recent trip through many of our host city’s most famous farmers markets yields interesting merchandising techniques to start your 2015 summer market season off with a bang and hopefully a few more bucks in your pocket!


Successful marketers in Spain’s bustling market places are pairing age old techniques with bright new merchandising tricks to make their produce pop!

Here are a few tips:

1. Careful stacking is paramount! First, form a solid base. You can’t pile it high if it rolls on the floor! Start with a stair step type foundation made of boxes, plastic reusable containers that stack to transport from the farm, or simply small boxes that you packed your product in to bring to market. Next, pad your stack to create a non-slip surface. This can be done with tissue paper or organic material such as leaves. Then stack your product in a pyramid formation, depending on its shape and resilience to stacking.


2. Display vertically. Think of the vertical space on your table and make good use of it! Typically customers can reach across a table at a distance of up to 4 feet if a display is tilted at an upward sloping angle compared to only a reach of 2 feet if they are forced to reach straight across the table in order to reach your item for their shopping basket. This can be achieved by providing steep sloping stair steps behind baskets and boxes angling them so products are served directly up to the customer’s ideal height and reach.


3. Think outside the box when making display rack choices. A unique display container or shelf can stand out if you limit your number of racks or other display items. Be sure not to crowd your stand with many small shelves or racks as this tends to give an over-decorated or busy look and distracts the customer from your product.


4. Height matters in the height of the season! When produce is plentiful and you must expand outside of your primary table be sure to raise items to an ideal level for your customer. An easy way to do this is to stack crates or boxes that you used to bring your product to market. Topping them with an eye-catching basket, cloth or other material makes items placed here stand out. This technique is also useful for special items you would like to highlight for the day in addition to when you have an overflow of tomatoes or large items such as winter squash.


Whatever your product or variety throughout the year, plentiful displays, friendly smiles, consistent easy-to-read signs and a thoughtful display will get your product noticed this market season.


by Carla Snyder, Ag Entrepreneurship & Marketing Educator, Penn State Extension