Authors

Showing posts with label Market research. Show all posts

Thursday, November 5, 2015

"Mandatory" social media platforms for agricultural businesses

By Dr Kathy Kelley, Professor of Horticultural Marketing and Business Management, and Dana Ollendyke, Extension Associate


Through an internet survey conducted by researchers at Penn State, Rutgers, Cornell, and New York University in 2013, 1,183 participants answered questions concerning their wine purchasing and consumption attitudes and behaviors and their demographic and socioeconomic status. Panelists were screened for being at least 21 years old, residing in one of the targeted mid-Atlantic states (New York, New Jersey, or Pennsylvania), and for having purchased and drank wine at least once within the previous year.

This survey may be focused on wineries, but the data collected can be of use to many agricultural business types. Marketing is an integral part of doing business.  Using social media to inform consumers about your products and events is an excellent way to build relationships.

John Gillespie, founder and CEO of Wine Opinions, a wine research company, stated in the article "Who’s Drinking Wine? A Look at the Wine Market Council’s Latest Survey" that 66% of core wine drinkers (those who drink wine at least once a week) and 40% of marginal wine drinkers (those who drink wine less frequently than once a week) use the internet to get information about wine. The article also said that more than half of all wine drinkers are on Facebook.

Consumers who participated in our internet survey were asked to select from a provided list of social media platforms they felt were mandatory for a winery to offer.  As you can see by Figure 1, Facebook is the significant front-runner.  Over 40% of participants believed that this social media tool is "mandatory" for a winery to implement.  Other platforms like Twitter, Pinterest, Instagram, and YouTube were significantly less important to respondents.

Figure 1. Social media platforms that survey respondents believed were "mandatory" for a winery to implement.


More information about the survey results can be viewed in the video series "Consumer Attitudes and Behaviors Towards Wine Purchases".

To learn more about social media marketing and the survey data, please see video 5 in the series.

As an agricultural business owner, what social media platforms do you use?  Which one(s) seems to drive the most interaction with your customers?

Friday, September 25, 2015

What Activities and Events Might Drive Customers to Your Tasting Room? Part 2

By Dr Kathy Kelley--Professor of Horticultural Marketing and Business Management, Abigail Miller--Master's student in the Penn State Plant Sciences Department, and Dana Ollendyke--Extension Associate


In part 1 of this series, we discussed survey results as to what activities and events respondents had the most interest. There are also other opportunities to make connections with local restaurants, cheese mongers, bakeries, chocolatiers, etc. For example, might one (or more) of these businesses create a small tasting plate that could be included in your “premier tasting option?” Or, could it be purchased separately for visitors to enjoy along with a glass of wine they purchase and consume at your tasting room? It is likely that some of your visitors would appreciate the opportunity to try a regional cheese with your wine.


Or, you could substitute the palate-cleansing crackers you provide to each taster with a few slices of bread from a local bakery. This is another great way to cross promote with other local businesses. While in Paris this last May, I participated in two separate tasting events at O-Chateau Wine Tasting & Wine Bar (o-chateau.com). Along with a breakdown of what my tasting fee would include (five still French wines and one Champagne, a two-hour session with an English speaking sommelier, and a private tasting room for no more than 12 participants), the description also alerted me that not only would bread be included, but that I would be tasting baguettes from the bakery that supplies items for the president of France. Though some participants might not consider this as being a benefit or anything special, others might find it appealing.


With 70.2% of our participants responding that they would be interested in visiting a winery that offered “holiday events,” consider occasions that might be a good fit with your wine. Commonly celebrated holidays such as Valentine’s Day, Thanksgiving, New Years, and religious holidays might come to mind quite easily, but don’t forget local holidays or events that may appeal to your tasting room visitors. For example, the neighborhood of Bloomfield (in Pittsburgh, PA) holds an annual Italian heritage festival called “Little Italy Days” (http://littleitalydays.com). A winery tasting room could partner with a local Italian bakery to pair wines with Italian pastries.

While a “painting party/class” and “book clubs” were of less interest to our participants, it is possible that such events and activities might still be of great interest to your visitors. As with any new marketing idea or change you make, it is essential to make sure that “it” is a good fit for your business, then trial “it,” and finally evaluate “it.”

Just a few things to think about as you plan your future winery tasting room activities and events. You may want to even consider planning an event to celebrate Wine Tourism Day on November 7th (http://www.winetourismday.org). In its third year, the day is planned to encourage wine tourism businesses, including hotels and restaurants, to offer events as a way “to celebrate the importance (and fun) of wine tourism.” Another opportunity to raise your glass and celebrate!


Additional Research & Thesis Advisory Team Members:

• Jeffrey Hyde, Professor, Agricultural Economics, The Pennsylvania State University

• Denise Gardener, Extension Enologist, Department of Food Science, The Pennsylvania State University

• Brad Rickard, Assistant Professor, Charles H. Dyson School of Applied Economics and Management, Cornell University

• Ramu Govindasamy, Professor, Department of Agricultural, Food and Resource Economics, Rutgers University

• Karl Storchmann, Clinical Professor, Economics Department, New York University; Managing Editor, Journal of Wine Economics

• Rob Crassweller, Professor, Professor of Tree Fruit, The Pennsylvania State

University


The project “Developing Wine Marketing Strategies for the Mid-Atlantic Region” (GRANT 11091317) is being funded by a USDA Federal-State Marketing Improvement Program grant, whose goal is “to assist in exploring new market opportunities for U.S. food and agricultural products and to encourage research and innovation aimed at improving the efficiency and performance of the marketing system.” For more information about the program, visit http://www.ams.usda.gov.

Friday, September 11, 2015

What Activities and Events Might Drive Customers to Your Tasting Room? Part 1

By Dr Kathy Kelley--Professor of Horticultural Marketing and Business Management, Abigail Miller-- Master's student in the Penn State Plant Sciences Department, and Dana Ollendyke-- Extension Associate


In 2014, researchers at Penn State, Rutgers, Cornell, and New York University collaborated on a wine marketing study funded by the USDA. Data were collected through a 15-minute Internet survey (22-24 October 2014). Participants residing in New Jersey, New York, and Pennsylvania were screened for not being a member of the wine industry, being at least 21 years old, and for having purchased and drank wine at least once within the previous year. A total of 977 participants qualified and completed the survey.

With approximately “81% of [Pennsylvania wine] sold directly from wineries” (http://bit.ly/1LygxFl), one of the issues we investigated in last year’s survey was what a winery could offer to encourage winery tasting room visits and increase the frequency of these visits.  While, in some cases, we investigated broad categories and factors, we have plans to delve deeper in an upcoming survey to see what could motivate consumers to visit a winery tasting room and barriers survey participants feel prevents them from visiting.

Interest in winery activities and events

Today’s visitors do much more than just taste the wine at a tasting room; rather, there are opportunities to tour the vineyard and the wine-making facility, participate in classes, attend festivals, and much more (http://bit.ly/1JtOEHK).

But should a winery go through the process of planning, implementing, and evaluating an event or activity?

Data from a study conducted by researchers at Texas A&M University and Sam Houston University showed that, for Texas wineries, there was “a positive correlation between wineries that offer services such as tasting rooms and tours and gross sales… [thus] the more tourism services a winery offers, the higher their potential for gross sales” (http://bit.ly/1NSBgRx),

OK, so, with all that could be offered – what activities and/or events might garner the greatest consumer interest?

Though not an exhaustive list, we focused on activities and events that were more commonly found when we investigated wineries online and also based on popular press articles. As an example, an event that has been offered at some wineries and restaurants is a “Paint Nite,” during which attendees paint a certain picture by following an instructor while enjoying wine or other alcoholic beverages (for example, https://www.paintnite.com/). We were interested in learning if this activity appealed to our participants, and, if so, how much. Below is a table with data pertaining to the level of interest our participants expressed based on the seven activities/events that we tested.


As you can see, “tasting events,” “tour of the winery and vineyard,” and “food vendors from local restaurants,” were the three activities that had the highest level of interest (86.3%, 83.0%, and 78.9%, respectively), and are often interdependent of each other.

It makes sense that if someone is going to visit a winery tasting room that they would be interested in tasting the wine, but there are opportunities to offer “tasting events” that go a beyond the norm – perhaps they could be based on a theme, focus on your new release, be an exclusive tasting with limited seating, or your winery tasting room could be one of the stops on a local food tour.

And, although separate categories in our survey, winery tastings and tours are a natural pairing. Most likely you already offer a tour and subsequent tasting, but can you take your standard tour and split it up into several? The goal of this strategy would be to encourage even more frequent visits.

Château Élan Winery & Resort located in Atlanta, GA offers six different tour options, five are private and one is offered on a regular basis. While all six tours end in a tasting, each is unique with a different focus (http://www.chateauelan.com). The private tours focuses on each of the following: 1) the vat room, 2) the wine making process, 3) the vineyard, 4) an experience with the wine maker, and 5) a session on other Georgia food products.


More data on winery activities and events will be discussed in part 2 of this series.


Additional Research and Thesis Advisory Team Members:


• Jeffrey Hyde, Professor, Agricultural Economics, The Pennsylvania State University


• Denise Gardener, Extension Enologist, Department of Food Science, The Pennsylvania State University


• Brad Rickard, Assistant Professor, Charles H. Dyson School of Applied Economics and Management, Cornell University


• Ramu Govindasamy, Professor, Department of Agricultural, Food and Resource Economics, Rutgers University


• Karl Storchmann, Clinical Professor, Economics Department, New York University; Managing Editor, Journal of Wine Economics


• Rob Crassweller, Professor, Professor of Tree Fruit, The Pennsylvania State


University


The project “Developing Wine Marketing Strategies for the Mid-Atlantic Region” (GRANT 11091317) is being funded by a USDA Federal-State Marketing Improvement Program grant, whose goal is “to assist in exploring new market opportunities for U.S. food and agricultural products and to encourage research and innovation aimed at improving the efficiency and performance of the marketing system.” For more information about the program, visit http://www.ams.usda.gov.

Friday, August 14, 2015

What is Cause Marketing? Part 3

By Dr Kathy Kelley, Professor of Horticultural Marketing and Business Management, and Dana Ollendyke, Extension Associate


This post will continue to outline some of the important topics to consider in deciding if a cause marketing plan is right for your business. (Post 1 and Post 2 in this series have been published in previous weeks.)

Promote that you are also accepting donations
In addition to selling a product or two where the proceeds go directly to support the cause, let customers know that they can also donate funds to the cause.  You, as the business owner, may assume that consumers would automatically understand that there is more than one way to support a cause; however, it may not occur to consumers that they can make a donation in place of making a purchase.

Involve customers in selecting the cause
Two separate strategies can be used to involve consumers in selecting the cause:
  • ask consumers to nominate a cause and then vote on the one that will receive all the donations.
  • allow consumers to choose from a group of causes that would receive the donations.
This second technique is what ONEHOPE Wine has embraced. The brand donates half of all profits to a list of causes including: Cure Alzheimer’s Disease, Support Our Veterans, Save Our Planet, and several others. Each wine is associated with a specific cause. In Image 1, you can see that half of the profits for the 2009 Santa Barbara Reserve Chardonnay helps fund research to find a cure for Alzheimer's Disease.

Image 1.  Bottle of OneHope wine that benefits research to find a cure for Alzheimer's Disease.


Involve employees
Finally, employees should be asked to do more than just collect donations or indicate what purchases support the cause.  Involve them in the process of selecting the cause and associated administration needed to support events or activities.  The more employees support the effort, the more likely they are to alert customers that your business is involved in collecting donations to help those in difficult situations.

As with any new marketing program, it is very important to DO YOUR RESEARCH to determine if this is the right path for your business. 

Friday, August 7, 2015

What is Cause Marketing? Part 2

By Dr Kathy Kelley, Professor of Horticultural Marketing and Business Management, and Dana Ollendyke, Extension Associate

The first installment in this series can be found here.
With so many local, national, and international causes already being supported by your customers’ generosity, how can you compete with them and the businesses that sponsor them?  Consider the following, which could help bolster your cause marketing program.

Make sure that the donation process is transparent  
For each dollar that you collect, you need to show how and where these funds were distributed. Consumers who do not see any progress associated with the money they donated may very well choose not to donate anymore.  Be sure to indicate on your website, in your promotional activities, and in-store that money collected helps to do great things.

Consider a cause that has a natural connection with your business  
Perhaps a member of your business has suffered from a disease that could benefit from a donation.  If this is the case, ask him or her to be the “face” of the effort. In the Wharton Business School article "To Increase Charitable Appeal to the Heart-- Not the Head", it describes how consumers are more likely to donate to a cause if “presented with a personal case of an identifiable victim” through pictures and stories, “something that purely engages the emotional system”.

For example, we can all probably think of at least one product that dons a pink ribbon in honor of breast cancer research.  One of the businesses that does so is J. Lohr Vineyards & Wines.  The winery actually began partnering with cause organizers due to a family member’s breast cancer fight.  Founder Jerry Lohr lost his wife, Carol, in 2008 and through sales of both J. Lohr Carol’s Vineyard Cabernet Sauvignon and Sauvignon Blanc, the company had a 2014 goal of “providing over 4,000 mammograms to women who would otherwise be unable to afford them”. Certainly, the cause is worthy enough, but by associating a name, story, and image of Carol Lohr, we begin to associate the brand with a real family – not just a business.

Image 1.  Screenshot of the J. Lohr Vineyards website that details their mission to provide mammograms to women in need.
blog photo 3

Or perhaps there is an environmental issue that greatly impacts your city/state/region. Sales from Crimson Pinot Noir, produced by Ata Rangi Vineyard (Martinborough, New Zealand) supports Project Crimson, “to protect and renew our spectacular red-flowering rata and pohutukawa – New Zealand’s iconic native ‘Christmas trees’.” Not only can consumers support the cause by purchasing this wine (Image 2), they can also purchase Northern Rata trees and plant them on their own property (Image 3).


Image 2.  Label showcasing the partnership with Project Crimson.
blog photo 1Image 3.  Sign advertising the sale of the rare Rata trees.blog photo 2


More considerations on creating a cause marketing program to follow in part 3 of this series!

Friday, July 10, 2015

Internet Tools to Help You Learn About New Markets, Part 4

By Dr Kathy Kelley, Professor of Horticultural Marketing and Business Management, and Dana Ollendyke, Extension Associate

In our previous post, we discussed using Easy Analytic Software Inc (EASI), which allows users to more easily search Census data.  This post, which will be the final one in this series, will focus on Geographic Information Systems (GIS) reports from the Small Business Development Center (SBDC).

These reports are free of charge to prospective or existing small business owners who are receiving business-counseling services from their local SBDC Advisor.
Some of the reports include:
  • Competition maps—These maps show the location of individual competitors in relation to a small business location.
  • Competitor lists—These lists can include a competitor’s company name, location, number of employees at each location, whether the location is a competitor’s single location or branch, estimated annual sales volume, the competitor’s NAICS (North American Industry Classification System) and SIC (Standard Industrial Classification) codes and a latitude and longitude coordinate.
  • Consumer expenditure comparison reports—These reports help clients evaluate the relative demand for their chosen industry within their local market area, county, state, and the nation.
  • Drive time reports—The time it takes to travel to a local store or restaurant can be a significant factor in defining the target market for a small business. These highly detailed maps show the geographic boundaries of a small business’ target market customized to the amount of time considered acceptable to the small business’ clientele (Image 1).
Image 1. A sample Drive Time Map showing the market area that can reach a small business destination in Lakewood, CA within 10 minutes. (Contact your local SBDC for a customized map.)


Certainly, this blog series doesn’t discuss all that is needed to better understand consumers’ attitudes, behaviors, etc. towards wine based on their race and ethnicity. It does, however, provide some tools that are useful in gathering data and learning about the population of racial and ethnic groups you could serve in your community.
There are other components such as the consumer’s level of “acculturation,” which is the “cultural modification of an individual, group, or people by adapting or borrowing traits from another culture” (http://bit.ly/1xEH2NK). To demonstrate this point, we will use an example from Kathy’s family. Her sister-in-law was born in South Korea and came to the U.S. 15 years ago. As she has become more ingrained in U.S. society, some of her habits and preferences have become more “mainstream” American. Not only can food choices, etc. change over time, but as someone becomes “fully acculturated,” their language preference can change from their native language to English (http://bit.ly/1IxluaM) which could impact how you choose to promote your wine.
Another component is to search the Internet for “wine and Asian culture,” “wine and Chinese culture,” etc. to learn about wine style preferences and how wine is consumed (e.g. wine and Coke or wine cocktails). Also, don’t forget to investigate what culturally significant holidays these consumers celebrate.
Regardless, conducting adequate research is crucial when developing a realistic marketing plan. By finding out as much as possible about viable consumers, you will have a much better chance of understanding their needs and wants and hopefully gaining them as customers.

Monday, June 8, 2015

Internet Tools to Help You Learn About New Markets, Part 2

By Dr Kathy Kelley, Professor of Horticultural Marketing and Business Management, and Dana Ollendyke, Extension Associate


In our previous post, we discussed exploring new ways to market your products. We listed 3 of our favorite internet tools:
  • The US Census Bureau website.
  • Easy Analytic Software Inc (EASI) Demographics tool.
  • Small Business Development Center's Geographic Information Systems (GIS) reports.

In this post, we will focus on The US Census Bureau website. Census data is presented in multiple ways including:
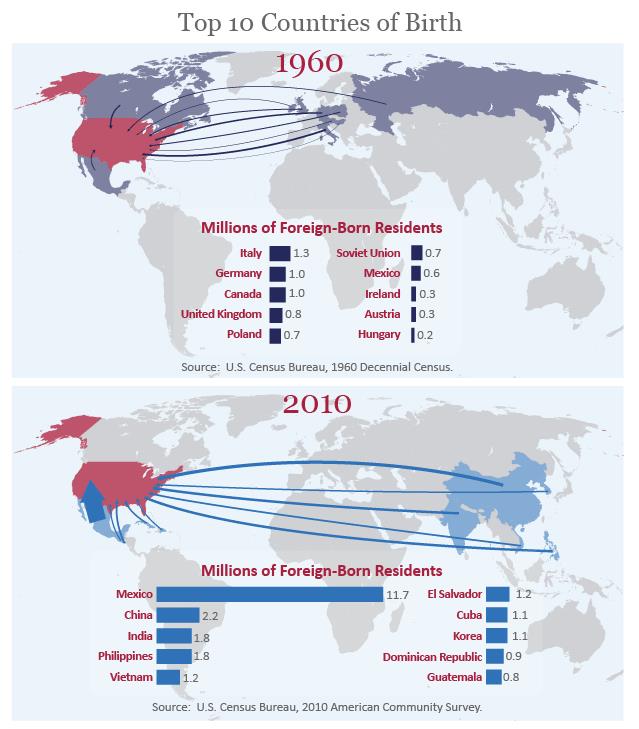
  • infographics (an example is presented in Image 1, below).
  • interactive maps.
  • audio.
  • photos.
  • publications.
  • video.
  • working papers.
  • software.
Image 1. Infographic displaying the changes in the number of foreign-born residents in the U.S. (1960 to 2010) and their native countries (Source: U.S. Census Bureau).


For this series, we will continue to use wine as our example.

Imagine that you read an article about which alcoholic beverages pair well with authentic Chinese food and you learned that Rieslings are a good choice since “they go well with Chinese cuisine because the mouth-feel is quite refreshing…the range of dry to sweet Rieslings can match all types of Chinese food, plus it’s never too heavy, but rather fresh and fruity.” Now you begin to think about:
  1. how you could inform current customers that your wines pair well with this popular cuisine (this article provides wine pairing recommendations for “Americanized Chinese” takeout – which also suggests Riesling as being an appropriate choice) and 
  2. how you could promote your Riesling to the Chinese consumers who may live in your region.
One of the first things you want to do for #2 is to learn whether there is a population of Chinese consumers in your county or metro area (and city if the population is large enough) and how many are ages 21 and older. For this example, we used the State College, PA metropolitan area as the location for learning about the existence and number of adults who responded during the 2010 Census that they were “Chinese (except Taiwanese) alone or in any combination.”

The tool we are demonstrating also allows us to search for data for “Chinese alone or in any combination” (which would include Taiwanese) and “Taiwanese alone or in any combination.” Hence, you can get fairly specific with your data requests. (The “alone or in any combination” means that the data describes those who indicated on their Census form that they were only Chinese as well as Chinese consumers who indicated that they were also of another race/ethnicity).

The abbreviated table below provides the following information: Total Chinese population (3,360 individuals in the State College, PA metropolitan area), as well as a breakdown by age range (e.g. 68.1% of these individuals were 21 and older in 2010), and the number of males who were between the ages of 20 and 24 (524 or 15.6% of the total population of Chinese).

Image 2. A portion of a table that describes the total population of Chinese (except Taiwanese) and breakdown by age range and other characteristics based on the 2010 U.S. Census.


There are many ways to build tables like the one presented for this demonstration. We simply used “metro/micro statistical area within state” and “Race and Hispanic Origin” as our search criteria and then selected the “DP-1 Profile of General Population and Housing Characteristics: 2010” (Image 3).

Image 3. Search fields and options available to create tables like that in Image 2 (From the US Census Bureau website).


One caveat is that data is only available if more than 100 individuals are in the group you are investigating. For example, with the State College metropolitan area being less populated than other metro areas in the state, there were not enough “Argentinians,” “Nicaraguans,” or others from select South American countries to create tables (though we were able to learn that at the time of the 2010 Census, there were 651 “South Americans” residing in the metro area). In contrast, data for the much larger metropolitan Philadelphia area showed that there were 2,336 Argentinians residing in this location. If there is a large population of Argentinians in your area and you want to promote a wine that will pair well with traditional “pork dishes and rich, winter-warming meat stews” then you would focus on your Cabernet Sauvignon (http://bit.ly/LjvC0R).

As you can see, the US Census Bureau website can provide a tremendous amount of demographic data for your specific target market location. Our next tool for learning about new markets is the Easy Analytic Software Inc (EASI) Demographics tool which will be discussed in the next post.

Tuesday, February 18, 2014

Do You Know Your Customers?

by John Berry, Extension Educator, Lehigh Co.

Do you know who your customers are today; who they will be ten years from now?  Successful marketers do.  Consumers are constantly changing, from their ages and attitudes, to their incomes and ethnic mix.  In order to successfully meet consumers' wants and needs, we must anticipate and respond to them before a demand for a product or service even exists.

Plan to Keep in Touch
Email lists are one method of staying in contact
with your customers on a timely basis.
One key advantage of direct marketing is contact with customers.  People seek the personal attention that is available from most farm retailers.  The benefit to the grower/marketer is first-hand knowledge of customer wants.  Make the most of this direct customer contact.  At the very least; ask your customers to record their name, address, and email in a notebook that is kept near the check-out.  Also consider collecting other electronic media contacts customers may be utilizing.  Once a notebook is started, you now have a mailing list.  This can help maximize promotional efforts.

Customers will develop a personal connection to your market if they are kept informed.  Is opening day next week?  Is there a huge crop of melons coming ripe?  Why not send an announcement to your regular customers?  Offer a discount on quantity purchases.  This type of effort is well received.  It helps you move product and it establishes loyalty in your customers.

Try to Keep Ahead
One way to prepare for tomorrow is to study changes in consumer demographics.  What do households look like?  What do consumers like to do with their free time?  Which consumers have the highest disposable income?  What would they be willing to spend it on?  How are these factors expected to change in the future?

Planning for the future is usually a guess.  To increase the confidence in this guess, try to base it on as much fact as possible.  The amount of information already gathered and analyzed is staggering.  The local library, township authorities, the department of transportation, and your Extension office can be possible sources of trend information.

Did You Know?
Here are general statistics from the Census Bureau.  Remember, these are for the entire population.  Try to answer some of these questions with the data that is specific to your customers.  By the year 2015, households without children under 18 will outnumber those with kids by 14 million.  The projections for the types of households we can expect are as follows: Couples without children, 32%; Women living alone, 17%; Men living alone, 14%.

How might this impact your customers and their shopping behavior?  The average person spends less than 50 minutes a day preparing meals.  Those with a microwave oven spend 45 minutes, while those without a microwave spend 59 minutes.  Clean up time averaged 7.7 minutes each day.

How do you fit your product into microwave preparation and easy clean up?

Conclusion
I like doing what I know how to do, and I find adapting to change is seldom comfortable.  However, exceeding the demands of most retail consumers is a moving target.  Effective direct marketers learn to change and adapt.  The efficiency of adapting can be increased by considering the possible developments of the future before they arrive.  In the final spare moments we may have before the spring season is upon us - let's spend some time and effort developing a deeper understanding of what drives our current shoppers and developing a better guess of who our future customers might be.

Wednesday, January 8, 2014

Marketing "Sustainable Farming" to Consumers: A Research Review

A recent journal article by Hillary Sackett, Robert Shupp, and Glynn Tonsor includes results that may benefit some readers who are marketing products with a "sustainable" label.  I'll provide the short version here but you may be able to obtain a copy of the work from one of the authors.

Research Motivation & Background
Sustainable agriculture is often described as a farmer working to not only be profitable but also do no harm to the environment and the broader society.  This so-called "triple bottom line" is sometimes referred to as "Profit, People, Planet."  While many in the agriculture industry debate the term, sometimes strongly, it's clear that a segment of consumers make purchases based on their perceptions of sustainability and the practices that make a farm sustainable.  Food marketers need to understand these consumers in order to target promotional efforts accurately.

The researchers used an internet survey to gather feedback from 1,002 people in 2010.  There were two different versions of the survey; one for apples and one for beef.  For each, ten different characteristics of sustainability were defined.  These characteristics reflected 6 production practices, some of which were different between apples and beef.  (For example, one practice for beef was "prohibited use of antibiotics" and one practice for apples was "limited herbicide use.")  Using a method called "Best-Worst Scaling," the researchers repeatedly asked respondents to choose the most and least important options from a group that included six of the ten total characteristics.  By answering this type of question a number of times, with different groupings, the respondent's preferences become clear.

The researchers analyzed the data to determine the relative importance of each of these characteristics.  They did this first for the entire group of respondents and then they used a tool called "latent class cluster analysis" to group similar types of respondents.  The benefit of this type of tool is that the data naturally group themselves rather than the researchers providing their best judgment to group the respondents.  The researchers then explore the clusters to understand the factors that differentiate the clusters.  The results for both types of analysis are useful for marketers!

Primary Findings

Overall, the size of the farm was ranked significantly higher than any other characteristics for both apples and beef.  The factor related to "locally-grown" was ranked 2nd for beef and 4th for apples.  A full set of results is shown below.
Ranked preferences for measures of sustainability on apple and beef farms


The numbers in parentheses show the level of the preference among all respondents.  These can be compared against each other.  Therefore, small farms is nearly twice as important than the second option for both apples and beef.

The latent-class cluster analysis then provided four distinct groups of respondents for apples and five distinct groups for beef.  These are described below.

Apple Cluster Groups
  1. Localvores - 14% of respondents fell into a grouping that heavily valued local production.  These also valued minimal herbicide use and preventive/cultural pest control.
  2. Small Business Enthusiasts - 30% fell into a group that placed heavy value on farm size and financial stability of the farm.  These also valued several of the production practices roughly evenly.
  3. Price-Savvy Shoppers - 10% were consistently most concerned with food prices.
  4. Sustainably Indifferent - 46% placed roughly equal weight on the characteristics.  It is not possible to discern whether these respondents care little or greatly about these characteristics; only that they care roughly equally about them.


Beef Cluster Groups
  1. Animal Rights Activists - 15% place a great amount of weight on animal safety and pasture-based feed.
  2. Nutrition Buffs - 24% place a great deal of importance on limited antibiotic use, growth hormones, and pasture-based feed.
  3. Price-Savvy Shoppers - 10% indicate that price is the leading concern.
  4. Sustainably Indifferent - 41% fell into this group, as described above.
  5. Say No to GMOs - 10% placed full weight on the prohibition of genetically modified livestock.

Putting These Results to Work
The results of this work provide a bit of insight for the food marketer.  Assuming the apple-related results are applicable to other fruits, or maybe produce in general, you can see that themes of "small farms," "Integrated Pest Management," "local," and other production-oriented descriptors could be used in your marketing and promotional materials/websites/social media outlets.  The same could be done for beef (and possibly other meats) based on the beef results.

The research also does a nice job of segmenting the markets.  Based on my readings, I suspect that most of those in the "Sustainably Indifferent" groups are not actively seeking sustainably-grown products.  Of course, the "Price-Savvy Shoppers" are also not in the target market.  Therefore, the article provides some insights into why the others are in the market for sustainably-produced foods.  For apples, some consumers are most interested in buying local.  Others want to support small businesses, whether local or not.  For beef, some are most concerned about animal rights or non-GMOs while others view sustainable products as more healthy.

Use these and other related phrases on your labels as well as your promotional materials.  It should help you connect more deeply with your customers as you hone in on what concerns them the most.  Good luck!

_______________________________________________________________________
"Consumer Perceptions of Sustainable Farming Practices: A Best-Worst Scenario." (2013) Agricultural and Resource Economics Review. 42(2) pp. 275-290.

Thursday, April 18, 2013

US Ag Exports at an All Time High

Last week, the USDA released some wonderful news about agricultural exports.  From fiscal years 2009 to 2012, $478 billion in US ag products were exported, the highest 4 years in history.  Even better, 2013 is expected to break this record.

In a blog post by the USDA, these record-breaking sales were highlighted with a few examples.  2012 was the first year ever for China to reach an agreement with the US to accept shipments of US pears.  In this short time since the agreement was reached, China is expected to become one of the top five importers of US pears in just 2 seasons.  

Ship carrying containers full of US exports overseas.


Also, the Foreign Agricultural Service (FAS), Agricultural Marketing Service (AMS), Food Safety and Inspection Service (FSIS), the Animal and Plant Health Inspection Service (APHIS), and the US Food and Drug Administration (FDA) are collaborating on a certification program for exporting processed eggs and egg products like omelets, frozen egg patties, crepes, hard-boiled eggs, and mayonnaise.  These new market opportunities could reach an estimated $500 million in sales for producers.  

If you are an ag entrepreneur and are interested in exploring export opportunities, it's imperative that you DO YOUR RESEARCH as you would with trying any new opportunity for your business.  Some important questions to think about:


  1. Is there market demand for my product internationally?  Read about conducting market research in The Guide to Farming.
  2. Would I need to alter my product at all before selling it?  For example, think about local tastes, package/portion size, and religious cultural beliefs  (like Halal or Kosher certification) that might deter future customers.
  3. What laws do I need to follow in order to get my product exported?  Check with your state for more info about this.  Here is info for Pennsylvania producers.
As an ag business owner, do you currently export any of your products?  If so, to what countries?  Do you have any important observations about exporting?  If you are not currently exporting, have you ever thought about it?  Why or why not?

Tuesday, April 2, 2013

Research First, Act Second

by Michelle Kowalewski, Penn State Extension Educator, Susquehanna Co.

I recently received a call from a local dairy producer who is currently in business with his father.  His father plans to retire from the business in several years and the son would like to explore options with beef cattle production.  The reason for his call was to find our more information about certified organic.  The producer was very unfamiliar with the process to become a certified organic operation, but this is where his research began - by asking the question!  Whether you are already in an agribusiness or just looking to develop a business, it's important to research your industry.  Ask yourself the following questions:
  • What products and/or services should I consider?
  • What will it take to start this business enterprise?
  • What is the current economic landscape for this business?
  • Who will be my customers?
  • What are my options for reaching my customers?
  • What potential revenues can I expect?

Once you have considered these questions it's time to start your research.  Take a broad look at the industry (agriculture) in your area and then narrow in on the specific product you'd like to produce or service you'd like to provide.  Try looking at past, current, and future trends and try to understand how your product can fit in the marketplace.  Sources for your research can include:
  • Trade publications related to your area of interest
  • Visit federal, state, and local agricultural websites
  • Educational classes or webinars
  • Case studies
Attend educational workshops to learn about your area of interest

Perhaps one of the best methods of research is to conduct a farmer interview.  There is no better way to learn then from firsthand experience.  Talk to producers who are willing to share their experiences, both good and bad, is invaluable.  To find a farmer to interview, think of people you know or get names of potential producers from service providers in your area.  Once you've identified the person(s) you'd like to interview, come up with a list of questions and call to see when they would be available.  Try to pick a time during their "slow" season.  It's best to talk with multiple farmers - all will have different opinions and this will help you weigh out your decisions on what enterprise might be best for you.

Proper market research will help assure your that your preliminary market plan is addressing everything you need to do to prepare, promote, and sell your products.

Thursday, December 13, 2012

Hot Sauce is Hot in 2013! How Demographics Help Mold Food Trends

Fellow blogger Sarah Cornelisse recently tweeted a link to an Entrepreneur.com article on the biggest trends in business in 2013.  One of the trends included the popularity of hot sauces.  Hot sauce production is one of the 10 fastest-growing industries in the US reports IBISWorld, an industry analysis firm.


Why is the hot sauce industry expanding so much?  Both Dave DeWitt (producer of the National Fiery Foods & Barbeque Show) and IBISWorld point to the increasing popularity of international foods.  In the Entrepreneur.com article, they illustrate the increased sales of hot sauces.  "Research firm Mintel reports that sales of sauces and marinades--including hot sauces--jumped 20 percent between 2005 and 2010 and are expected to increase another 19 percent by 2015."

An article on PreparedFoods.com also discusses the popularity of spicy flavors.  In 2011,  the “Packaged Facts Food Shopper Insights Survey” showed that 53% of U.S. grocery shoppers “somewhat” or “strongly” agree they “like hot and spicy foods" with a percentage rise to 58% among Gen Y (born 1977-1994)  adults.  The article also says that, "The same survey revealed that a majority of adult shoppers seeking global foods purchase Mexican and Chinese/Japanese flavored items. However, a larger percentage of Gen Y adults than adult shoppers in general seek out Indian/South Central Asian and Middle Eastern flavors. This indicates a broad interest in global flavors of all kinds."

By knowing your target audience, you can develop the best marketing plan for your product.  For example, the  “Packaged Facts Food Shopper Insights Survey” showed  that 58 % of Gen Y respondents "like hot and spicy foods".  By looking at demographic information on PAMarketMaker.com, you could find where the highest concentration of Gen Y adults are in Pennsylvania (see Figure 1).  Thus, you can target the release of your product in areas where your audience is most highly concentrated.  

Figure 1.  Population concentration of 19 to 24 year olds in Pennsylvania.


Check out the Resources tab on PAMarketMaker.com for more information on using demographics in developing your marketing plan as well as relevant industry information.

Friday, September 28, 2012

Using PA MarketMaker to Market Your Business (part 5)


In my previous posts, I discussed how helpful PA MarketMaker (PAMarketMaker.com) is for marketing your ag business.  Another way MarketMaker can assist you is by providing you with market research.

In the process of marketing your products, you may want to use online directories to list your products and services.  In doing so, you will also want to perform market research to understand where your customers are and what you can do to meet their needs.

PA MarketMaker is loaded with census data to help producers find the best place to market their products and services.  This data is easily summarized on a map to show concentrations of consumer markets.

To explore Pennsylvania MarketMaker’s market research data:

1.  Visit PAMarketMaker.com and click on the drop-down box under the Market Research heading located in the upper left corner of the page.  You can then choose what data category you want to study: Age, Household Type, Race, Income, Education, Foreign Born, or Food Preferences.

2.  The second drop-down box will show choices within your chosen category.  Click Search when you are ready to view the available data.

3.  Your search will bring up a map filled with a great deal of information.  The key in the upper center of the page can help you see where the largest concentrations of your selected customer type lives.


Another feature of the Market Research section is the ability to explore the locations of a certain type of business as an overlay on the map.  For example, a grocery store manager looking for the closest producer of organic vegetables can query the website to find names and contact information.  To do this, click on the blue Business Search tab in the upper left corner of the page and select the type of business you are looking for.


Take advantage of this opportunity to market your products and services online!  Pennsylvania’s database has over 380 registered businesses and over 46,000 listings.


Tuesday, September 18, 2012

Using PA MarketMaker to Market Your Business (part 4)

Continuing on with this series on marketing with PA MarketMaker, another great feature of MarketMaker is the Buy & Sell Forum.  Do you have extra corn that needs to be sold by the end of the week?  Do you own a restaurant and need steak for this week’s menu?  The Buy & Sell Forum allows you to create ads for products or services you are looking to buy or sell.


Creating a listing in the Buy & Sell Forum

1. Once you receive your username and password, click on the “Login” button located in the upper right corner of the Pennsylvania MarketMaker homepage (PAMarketMaker.com).

2. Click on the “My Buy & Sell Ads” from the top menu bar.

3. On the next page, click “New Ad.”

4. From the dropdown menu, select from “Looking to Buy,” “Looking to Sell,” “Service and Equipment,” “Transportation,” or “Other.”

5. The Manage Ad page allows you to create an ad title, a complete description of what you are advertising, and length of time the ad should be posted. After you complete this, click “Continue.”

6. On the next page, you are able to upload up to five images about your ad. If you do not want to upload an image, simply click “Continue.”

7. The final page allows you to review your ad. If you find any mistakes, click the “Edit” button and make your changes. If you are satisfied, click “Continue.”

8. If you want to edit your ad, simply return to the Members Area and click on the “My Buy & Sell Ads” link.


Congratulations! You have just created a listing in the Buy & Sell Forum. The Pennsylvania MarketMaker website is full of other helpful information and tools.  In my next post, I'll discuss how to use MarketMaker for market research.

Tuesday, June 5, 2012

We’re eating smaller, frequent meals. Do you have a snack for that?


Quite a few reports have been published lately that describe how the U.S. consumers’ eating habits are changing.  One noticeable trend is that we are snacking more. 

If you are a food retailer, manufacturer, producers, restaurateur, or have another role in the food industry offering snacks could be a huge opportunity.  Think about how you, too, could meet consumer need for mid-meal or meal replacement products.  

Some reasons we are snacking more: 
  • Boredom, food budget,
  • our hectic grab-and-go lifestyles,
  • increased availability of portion controlled packaged items,
  • and weight loss/weight management programs and experts suggesting that more frequent, smaller    meals may be the key to a healthier lifestyle. 
Regardless of the cause, snacking has become a norm.  According to the USDA Agriculture Research Service, most U.S. consumers (90%) snack at least once a daily  and 62% of men and 68% of men snack two or more times a day (http://tinyurl.com/7tzt4qt).  

Not only has the research been published as to how often we snack, but recently the Hartman Group (www.hartman-group.com) held an online webinar about snacking, titled “The future of snacking and the influence of global flavors.” During the webinar, the presenter indicated that consumers have an interest in snacks made with authentic “global” or “ethnic” flavors.  Current popular ethnic flavors included:
  • Korean/kimchi, 
  • Lebanese/falafel, and
  • Photo source: http://tinyurl.com/7os9k8e

  • British gastro pub/pig trotters.  


Some of the flavors that we should expect to 
enjoy in the future are:
  • Nordic/caraway rye crisps, 
  • Moroccan/fennel crisps, 
  • Ethiopian/puffed millet, and 
  • Cambodian/lychee juice.  
It is easy to understand why U.S. consumers embrace ethnic flavors.  We are traveling more and are influence by the cuisines we try.  Some of us then return home and share meals made with these ingredients with family and friends.  It is also very likely that a consumer is embracing their heritage and preparing meals associated with their culture.  Or, like my family, cultures have been blended by marriage.  My sister-in-law is from South Korea and I can tell you that bulgogi (marinated beef) is delicious (especially when she uses kiwi and Sprit in the marinade).  

Whatever the reason – if consumers are eating foods with ethnic flavors at traditional meal times it only makes sense that they have an interest in snacks with a bit of these spices and tastes. 

Certainly, there are several other snack food trends that need to be considered including:

Photo Source: http://www.elskitchen.com/
  • Consumer interest in “natural” snacks, 
  • gluten-free options, 
  • sweet and salty combinations, and
  • low calorie options, for example. 


Deciding on the best snack for your business hinges on a few factors:
  • Snacks that complement your current offering (do you already offer seasoned popcorn, nuts or other crunch snacks?), 
  • your core products (e.g. fresh fruits/vegetables, meats, breads) and what snacks make sense for your business (if you are known for local fruits and vegetables does it make sense to offer your own brand of dried pineapple slices?), 
  • flavors or cuisine you currently focus on (can you incorporate Asian flavored products with what you current off?), 
  • your customer base (do you or could you tap into a local ethnic community that new snack offerings may appeal?), and
  • what equipment you need to process (or can your outsource manufacturing?) and stock new snack items (do you have or will you need freezers or coolers for dips and other perishables?).
Just a few things to think about as you explore how you could use trends, such as snacking, to increase sales.